Responding to the second UN Sustainable Development goal of ending hungers and achieving food security, ISSE studies food sustainability in the United States and world, using analytic models and pursuing systematic solutions. We assess the sustainability and resiliency of the global food systems by carefully considering socioeconomic, policy, and climate scenarios.


Jump to
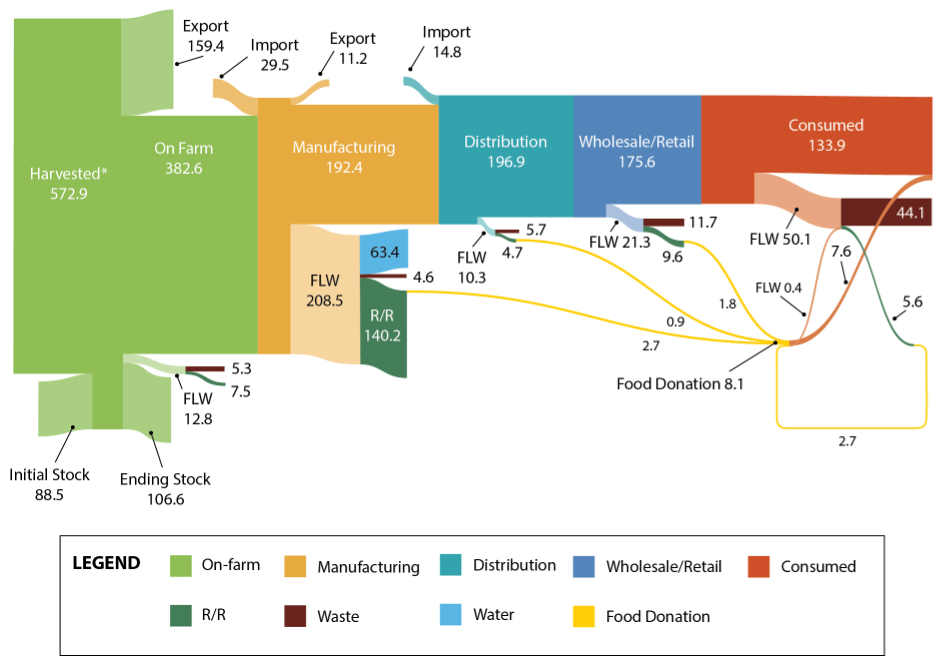
Food Loss & Waste
Quantification of food loss and waste (FLW) generation is a vital step to FLW reduction, recycling, and recovery. Working with Oak Ridge National Lab, we estimat the mass flow and FLW according to the real weight of commodities at each stage of the Food Supply Chain (FSC) and evaluate the management of U.S. FLW through nine management pathways. In 2016, 572.9 MMT of food materials were harvested for human food consumption, while 40.8 MMT of food materials were planted/raised but unharvested (i.e., failed to enter U.S. FSC), pulsing 302.8 MMT (52.8% of the food materials entered FSC; including water evaporated during food manufacturing) entered but left the FCS ended as recovered/recycled products or disposed of via landfilling, incineration, and wastewater treatment. Among the total of 343.6 MMT of FLW, 63.7 MMT (18.5%) is the weight reduction due to water evaporation during the manufacturing process of some food commodities (e.g., sugar), 193.7 MMT (56.4%) is recycled or recovered, and 77 MMT (22.4%) is disposed of via landfill, incineration or wastewater treatment (LWI). In addition, the management of on-farm animal-related FLW (8.8 MMT; 2.6%) is left as unknown due to the data limitations. The Consumption stage is the worst contributor to FLW disposed via LWI (51%). Conversely, even though U.S. food manufacturing contributes the most FLW (i.e., 208.5 MMT; 60.7% of total FLW), this stage demonstrates a high level of circular economy: only 4.6 MMT, 2.2%, of manufacturing FLW was landfilled or incinerated, 63.7 MMT (30.4%) is the weight reduction due to water evaporation which cannot be considered as waste, and the remaining was recycled or recovered (i.e., 140.2 MMT, 67.4%). However, U.S. food manufactures can contribute to a sustainable FSC by influencing the downstream stages, since the products with high demand and perishability contribute the most FLW and manufactures can contribute to FKW reduction by extending products’ shelf-life. along the U.S. FSC.
Sustainability of Global Crop Supply Chain
The largest challenges for global food systems are the spatial and temporal mismatches of their supply and demand. The crop supply chain (SC) helps to relieve the two mismatches through transportation, trade, and storage. However, long-distance shipment consumes a large amount of energy. Water, as a critical resource for crop production, is unevenly distributed all over regions and around seasons. The interaction as a Food, Energy, and Water System (FEWS) and spatial and temporal heterogeneity require a systematic and coupled method to study the global crop SC, which includes production, storage, transportation, distribution, and consumption. Funded by the National Science Foundation, we are developing a scalable framework that models decision-making in the global crop SC as embedded in the water resources and energy, socioeconomic, and policy environmentsand as affected by prices and climate factors. The framework will be applied to assess the sustainability and resiliency of the global crop SC as a FEWS under carefully designed socioeconomic, policy, and climate scenarios using the global soybean and wheat SCs as a case. Key performance indicators will be developed to measure individual and corporates utility, societal welfare, and environmental sustainability and identify technical, societal and policy solutions.